Understanding the Typical Serum Amyloid A Response Curve: The Key to Interpreting Stablelab® Results.
Author: Amy Poulin Braim, VDM, DACVS-LA, Senior Veterinarian, Equine Technical Services, Zoetis
Veterinarians use many types of diagnostics such as a thermometer, stethoscope, ultrasound and radiographs to determine medical conditions in their patients. What if there was a stall side reliable biomarker test that you could run in 10 minutes to let you know if you had a possible infection? Serum Amyloid A (SAA) is such a marker and can be measured by your horse’s side with the Stablelab ® EQ-1 Handheld Reader during the examination.
Stablelab helps identify inflammation due to infection by quantifying the concentration of SAA from a simple blood sample. SAA is a major acute-phase protein that is produced by a horse’s liver in response to infection; its concentration in the blood can indicate the severity of an infection. SAA can start to elevate above normal, often before clinical symptoms appear giving the veterinarian an indication to run additional diagnostics and get a jump start on treatment. Additionally, repeat SAA testing over the course of treatment allows the veterinarian to monitor whether the treatment is effective or not. [1,2]
Serum Amyloid A has been shown to be 30 times more sensitive than a thermometer, 3 more dependable for detecting inflammation caused by infection, monitoring disease progression, and return to health versus traditional lab tests. 1 Measuring SAA with Stablelab provides real-time results and is more accurate than traditional laboratory tests like WBC, fibrinogen and A:G at identifying infection in horses. [1,4,5]
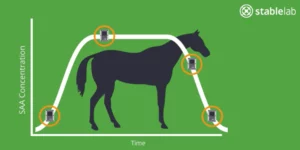
Serial Testing is Necessary to Identify Where A Horse is on the Response Curve
By understanding the typical SAA response curve kinetics, serial testing allows for easy interpretation of any result to Detect, Monitor and Screen any patient. It is important to identify the SAA peak value before one can monitor the timely decline of SAA in response to treatment.
–> Let’s consider the following scenario:
A horse with cellulitis was evaluated and initial SAA reading was 485µg/mL. After initiation of appropriate antimicrobial therapy, the horse was re-evaluated 4 days later and appeared significantly better clinically, but the SAA value is significantly higher 850µg/mL. How could this be? How can the horse look better, but SAA value is seemingly worse?
–> Explanation:
The initial SAA measurement was low on the left side of the curve at the very beginning of disease. The peak SAA value was missed (likely in the 2000-3000µg/mL range) in the 4-day treatment span from initial examination to follow up. SAA rose from the initial exam until antimicrobial therapy took effect and now SAA is on the appropriate downward trajectory on the right side of the curve. However, due to sample timing, SAA is higher than the initial baseline value. SAA rises and falls quickly, providing real time results. Understanding the response curve allows the veterinarian to visualize where those values lay. To confirm that treatment is working, veterinarians should run an additional test every 24-48 hours to follow the SAA course down to normal.
Real Time Results: Diagnostic Insight on the Spot
No need to send bloodwork to the lab and wait for results. Veterinarians can detect inflammation due to infection, and initiate treatment during the exam without ever leaving the horse’s side. This can save time, money and provides peace of mind to the owner that their horse’s veterinarian has another diagnostic tool to help give the best possible care, and that the horse is on the road to recovery. Tracking SAA concentration in subsequent exams allows the veterinarian to monitor how the horse is responding to treatment, or if a change to the treatment protocol may be indicated.
To learn more about the SAA response curve and incorporating SAA testing with Stablelab into every exam, contact your Zoetis Equine representative today or visit Stablelab.com.
Amy Poulin Braim, VDM, DACVS-LA, Senior Veterinarian, Equine Technical Services, Zoetis
References
1. Belgrave, R. et al. Assessment of serum amyloid A testing of horses and its clinical application in a specialized equine practice. JAVMA, 2013:243(1);113-119.
2. Oertly M, et al. The accuracy of serum amyloid A in determining early inflammation in horses following long-distance transportation by air. AAEP Proceedings, 2017;460-461.
3. Nolen-Watson R. How to Interpret Serum Amyloid A Concentrations. AAEP Proceedings, 2015;61:130-237.
4. Anhold H, et al. A Comparison of Elevated Blood Parameter Values in a Population of Thoroughbred Racehorses. JEVS, 2014;34(5):651–655.
5. Viner, M et al. Comparison of Serum Amyloid A in horses with Infectious and noninfectious respiratory diseases. Journal of Equine Veterinary Science. 2017 (49) 11-13.
6. Ludwig, E. et al. Serum and Synovial Fluid Serum Amyloid A Response in Equine Models for Synovitis and Septic Arthritis. Veterinary Surgery, 2016;45(7):1-9.
All trademarks are the property of Zoetis Services LLC or a related company or a licensor unless otherwise noted. Stablelab is a registered trademark of Epona Biotech Limited, used under license. All rights reserved. STB-00144R1